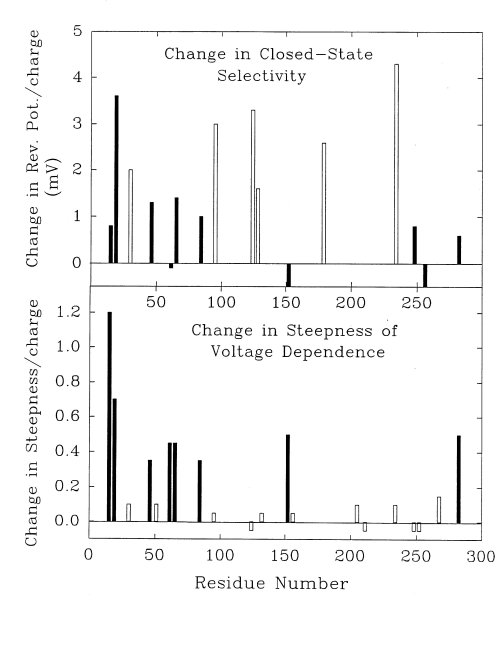
 Fig. 9. A comparison
of sites that had reduced effects on the selectivity of the closed state
with those that affected the steepness of the voltage dependence. The
upper panel shows the changes in the closed-state
reversal potential (normalized for the sign and magnitude of the engineered
charge change) of the sites that had
significant effect on the open-state selectivity
(Fig. 7). The open bars are sites that had an effect
on the selectivity of the closed state that was similar in magnitude to
that of the open state. The solid bars are sites
that had either no significant effect on the selectivity of the closed
state or an effect that was smaller than expected. The
lower panel shows changes in the steepness of
the voltage dependence (normalized as well) with significant changes in
solid bars and non-significant changes in open
bars. Positive values indicate changes that were
in the direction expected from the sign of the engineered charge change.
Fig. 9. A comparison
of sites that had reduced effects on the selectivity of the closed state
with those that affected the steepness of the voltage dependence. The
upper panel shows the changes in the closed-state
reversal potential (normalized for the sign and magnitude of the engineered
charge change) of the sites that had
significant effect on the open-state selectivity
(Fig. 7). The open bars are sites that had an effect
on the selectivity of the closed state that was similar in magnitude to
that of the open state. The solid bars are sites
that had either no significant effect on the selectivity of the closed
state or an effect that was smaller than expected. The
lower panel shows changes in the steepness of
the voltage dependence (normalized as well) with significant changes in
solid bars and non-significant changes in open
bars. Positive values indicate changes that were
in the direction expected from the sign of the engineered charge change.