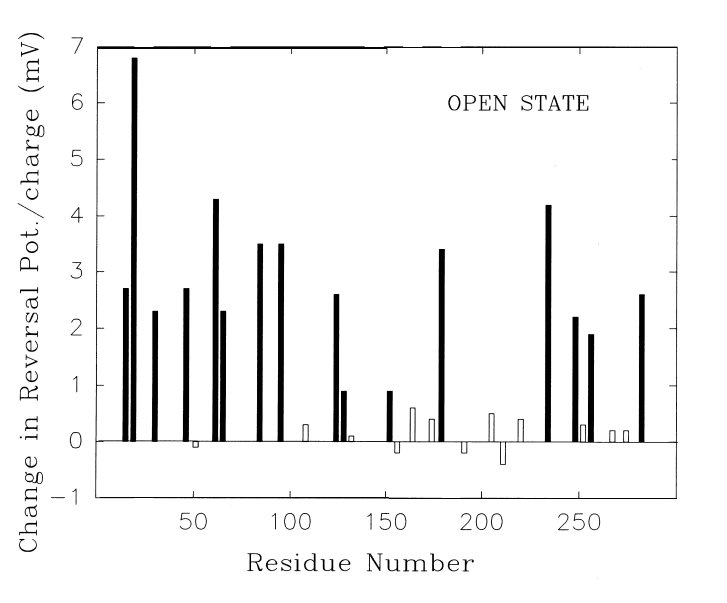
 Fig. 7. Observed changes
in the selectivity (reversal potential) in yeast VDAC channels following
single site-directed mutations. The reversal potentials were divided
by the magnitude and sign of the charge change
at the site produced by the amino-acid substitution. They are plotted against
the position of the residue from the N
terminus. The reversal potentials are compilations
of previously-published data (Blachly-Dyson et al, 1990; Peng et al., 1992a).
The were collected on single
channels after reconstitution into a planar membrane
(as in Fig. 1) in the presence of a 10 fold KCl
gradient. Positive values indicate that the selectivity change was in
the direction expected from the charge change.
Solid bars represent significant changes in selectivity.
Fig. 7. Observed changes
in the selectivity (reversal potential) in yeast VDAC channels following
single site-directed mutations. The reversal potentials were divided
by the magnitude and sign of the charge change
at the site produced by the amino-acid substitution. They are plotted against
the position of the residue from the N
terminus. The reversal potentials are compilations
of previously-published data (Blachly-Dyson et al, 1990; Peng et al., 1992a).
The were collected on single
channels after reconstitution into a planar membrane
(as in Fig. 1) in the presence of a 10 fold KCl
gradient. Positive values indicate that the selectivity change was in
the direction expected from the charge change.
Solid bars represent significant changes in selectivity.