Measurement and Regulation
of Blood Pressure
I. INTRODUCTION
Cardiac output (CO) is defined
as the volume of blood pumped by the left ventricle
in one minute. Thus, CO is the measurable parameter
that most directly reflects the delivery of blood
and its contents to the tissues. Although CO
is so critical to any evaluation of circulatory system
function, direct measurement requires difficult invasive
techniques which are beyond the means of most teaching
laboratories. For this reason, investigators
usually measure blood pressure (BP) which is directly
related to CO. From a thorough analysis of a
recording of BP, one can examine each of the cardiovascular
parameters that contribute to it.
II. PHYSIOLOGY OF BLOOD PRESSURE
Blood pressure results from
the pumping action of the heart against a variable
peripheral resistance into an elastic reservoir.
It will vary according to relative blood volume, elasticity
of the arterial system, the peripheral resistance,
the heart rate, and the stroke volume. The following
equations define this relationship:
BP = Total Peripheral Resistance (TPR) X CO
where
CO (ml/min) = Heart Rate (beats/min) X
Stroke Volume (mls/beat).
Finally
SV = End Diastolic Volume (EDV) - End Systolic Volume
(ESV).
TPR is determined by the
diameter of the blood vessels which, like HR and SV,
is under autonomic nervous system (ANS) control.
The SV is also influenced by the venous return which
depends upon the pressure difference between the arteries
and the right ventricle.
The elastic reservoir (i.e.,
the blood vessels) converts some of the energy of
cardiac contraction to stored energy. Part of
the blood ejected in systole is retained under pressure
in the expanded arterial reservoir. During diastole
this blood is propelled through the arteries to maintain
capillary flow throughout the cardiac cycle.
Because of this, the pressure in the arterial tree
is highest during systole, but it does not fall to
zero during diastole due to the elastic recoil of
the vessels and closure of the aortic valve.
The amount that it falls depends on the difference
between the outflow restriction due to the peripheral
resistance (TPR) and the rate and volume of blood
pumped into the arterial system. The end of
ejection is signalled by a notched transient in the
blood pressure curve produced by sudden closure of
the aortic valve. This transient is called the
dicrotic notch and is followed by the dicrotic wave.
Figure 1 illustrates a direct recording of
blood pressure from a rat and an expaned view of a
single pressure wave.
The blood pressure is regulated
by the autonomic nervous system. The parasympathetic
branch of the ANS directly innervates very few peripheral
blood vessels. Activation of the parasympathetic
system reduces blood pressure by slowing the heart
and by decreasing TPR via central nervous inhibition
of the tonic sympathetic output to the blood vessels.
The decrease in arterial peripheral resistance reduces
the pressure differential between the arteries and
the right ventricle, resulting in a decreased rate
of venous return. Therefore, CO is reduced.
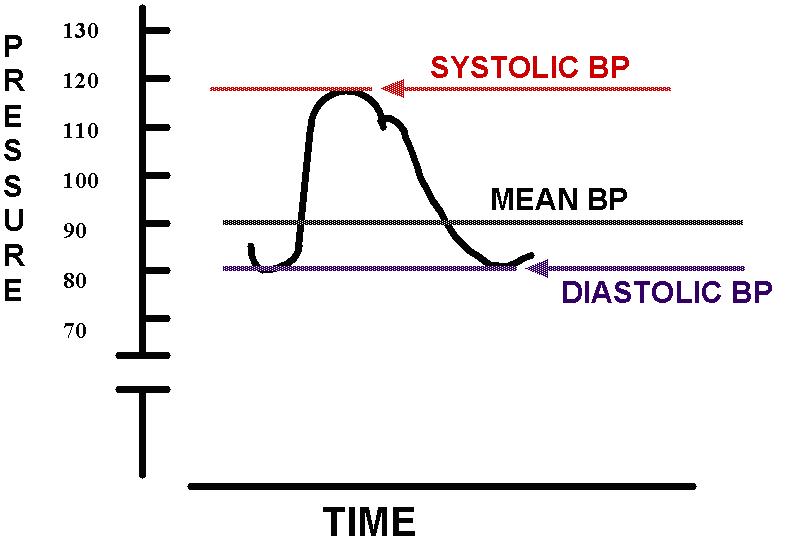
Figure 1
Conversely, activation of
the sympathetic division of the ANS raises BP by increasing
TPR, HR, and the force of ventricular contraction.
The increased TPR and cardiac contractile force increase
venous return and, consequently, CO.
There are other (humoral)
factors modulating BP, but the ANS is the major regulatory
input in BP control. ANS control over blood
pressure is mediated in the medulla by the carotid
sinus and related reflexes. Afferent impulses
from pressure receptors in the carotid sinuses and
aortic arch continuously send impulses via cranial
nerves to the medulla. These impulses, after
integration, are relayed to regulate the heart via
the cardiac branches of the vagus and sympathetic
nerves.
Keep in mind:
Cardiac Output is affected by HR x SV, BP/TPR, and
Venous Return.
Venous Return is affected by pressure differences
between arteries and veins.
Stroke Volume is affected by filling time, VR, and
the difference between End Diastolic Volume and End
Systolic Volume.
III. SUMMARY OF EXPERIMENTAL PROCEDURES
You will directly record
BP, the rate and relative depth of respiration, and
the electrocardiogram (ECG) of an anesthetized rat.
Sections of small diameter polyethylene tubing (i.e.,
cannulas) will be inserted into a jugular vein (for
injecting drugs) and into a carotid artery (for directly
recording the BP). See Figure 2.
A force-displacement transducer will record the rhythmical
chest movements associated with inhalation and exhalation.
All data will be recorded via the computer and the
WINDAQ data acquisition program.
You must be familiar with
WINDAQ/200, and WINDAQ playback(described
in a previous chapter).
IV. METHODS
A. Anesthetic
Urethane
is injected intraperitoneally (I.P.). The stock
solution urethane is 500 mg/ml. The initial
dose is 150 mg/100 g body weight. Hint:
weigh the animal and check the dosage chart on the
wall by the hood!
If the
animal is not anesthetized after 15-20 minutes, the
intermediate dose is given. The first intermediate
dose is 3/10 of the initial dose.
If after
another 15-20 minutes, the rat is not fully anesthetized,
supplemental dose is given. The supplemental
dose if 1/10 the initial dose.
The state (depth) of anesthesia is frequently monitored
by checking the pedal and corneal reflexes.
You should not proceed until the animal fails to generate
a reflex response after corneal or pedal stimulation.
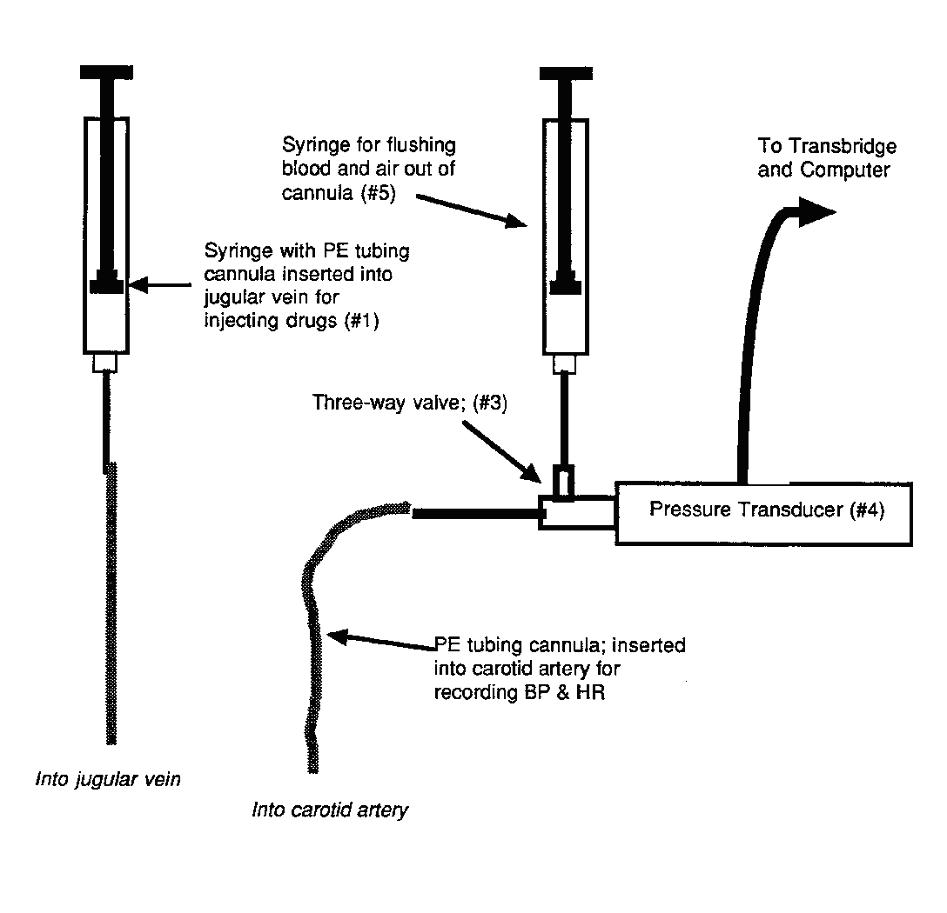
Figure 2
 B. Recording Equipment
Please refer to Figure 2 for a diagrammatic
representation of the experimental data recording
equipment.
#1 Jugular vein cannula -
inserted into the jugular vein and connected to
a
1 ml syringe. Used to inject drugs i.v.
#2 Carotid artery cannula
- connected to the 3-way valve on the pressure
transducer.
Provides a means for directly recording the arterial
BP.
#3 3-way valve - links the
carotid artery cannula to the B.P. transducer
and a 10
ml syringe for flushing saline through the transducer
and the cannula).
#4 B.P. transducer - converts
force due to BP into voltage which is amplified
by
the transbridge and recorded using the computer and
WINDAQ.
#5 10 ml syringe - for flushing
saline through the cannula and BP transducer.
#6 Force-displacement transducer
- NOT SHOWN -allows direct recording
of
rate and relative depth of respiration via a ligature
hooked to the animal's
chest
wall.
Before beginning the surgical
procedures, the blood pressure transducer must be
flushed with heparinized saline (10 units/ml) and
completely filled with fluid (no air bubbles!).
This must be done before you insert the carotid cannula.
Failure to eliminate the entrapped air will result
in the recording of an inaccurate pulse pressure due
to the compressibility and elasticity of air.
Make certain that you can
correctly manipulate the three-way stopcocks.
Remember that the lever points to the closed port.
You are ready to start the WINDAQ program.
The blood pressure transducer
is connected to a transbridge channel.
Be sure to connect
the transducer via the transbridge amplifier to the
computer input box. You should have two channels
(one for BP and one for respiration) on the computer
screen. Turn your attention to the one with the BP
display and position the trace so that the 0 pressure
reading is at the bottom of the screen. Using
the pressure module (get it from the TA), you must
calibrate the transducer so that blood pressure can
be recorded in mm Hg. Connect the module to
the instrument and, using WINDAQ, record the 0 and
100 mm Hg calibration pulses. To do this, make
sure that the transducer is sensing 0 or atmospheric
pressure (i.e., is open ot the air) and start recording
the data onto your data disk. Place an event
marker on the record at "0" pressure. Use the
module to simulate 100 mm Hg and mark it. Stop
recording data and note that these two event markers
correspond to your high and low pressure values.
You must put these calibration values into each
new data file that you open.
C. Surgical Procedures
Secure the rat (on his back) to a surgical
board. At all times the rate and depth of respiration
should be observed.
Begin the surgery by making
a longitudinal midline incision in the neck region.
Lift the skin along the midline of the neck with toothed
forceps. Snip the raised skin (only the skin)
with scissors to make a hole in the neck skin.
Now insert the ends of blunt scissors in the incision
and spread them along the midline. This will
open the neck region and expose the underlying muscle
layers. Attach the hemostats to the flaps of
skin on each side of the incision. This will
hold the skin aside and expose the underlying tissues.
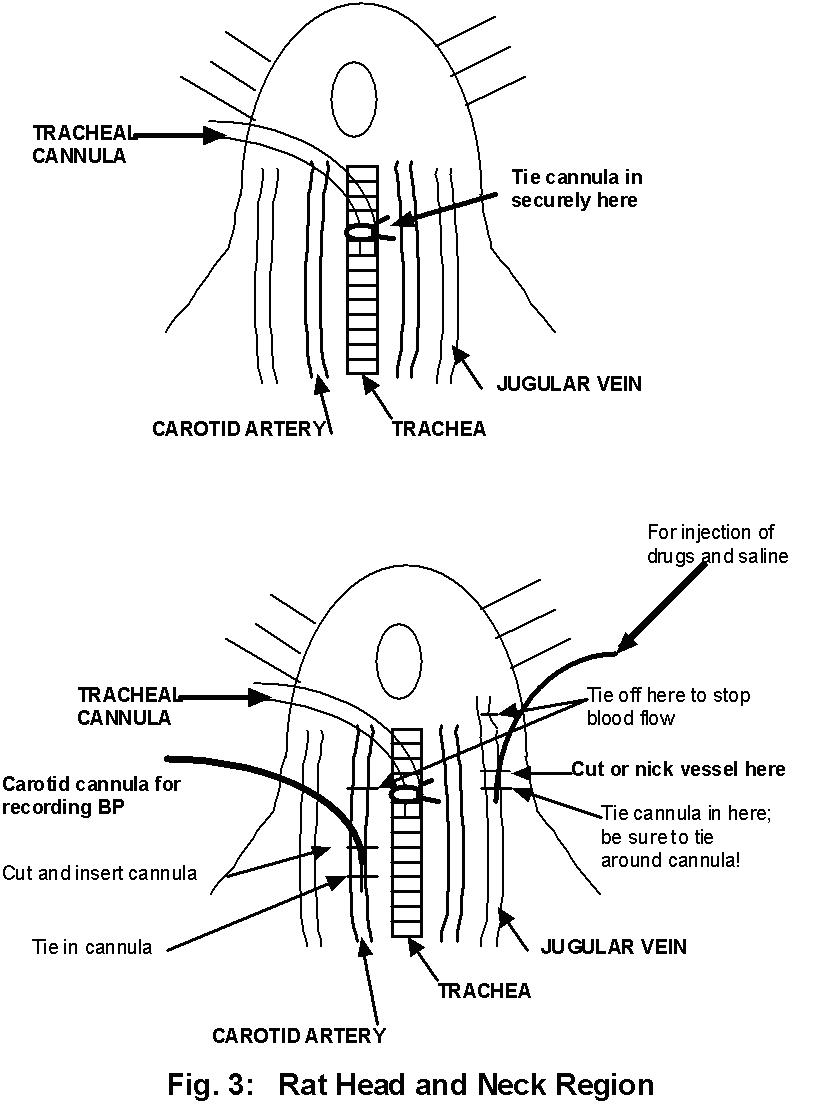
With glass probes and forceps,
spread open the muscle layers and expose the trachea.
Raise the trachea by placing a probe underneath it.
Now carefully snip half way through it and quickly
insert a small cannula. It may be necessary
to secure the cannula by tieing thread around the
trachea and the inserted portion of the cannula.
The tracheal cannula is used to facilitate respiration.
In addition, if the animal experiences respiratory
failure, a respirator can easily be connected
to the cannula. Remember to adjust the inspiratory
volume to expand the chest but not to burst the blood
vessels of the lung.
Now expose the right jugular
vein. Never! Never! Never! probe an incision
with a sharp surgical instrument!. Use blunt
dissection only! It will take patience to separate
the jugular from the connective tissue. Once
this is done, however, lift up the vein with one of
your glass probes and place a ligature cephalic to
the elevated portion. In addition, place two
threads under the jugular below the elevated portion.
Make certain the jugular cannula is filled with heparinized
saline. Then take a small needle, nick the vein,
slide the cannula into the vein towards the heart
and tie the cannula in place with two ligatures already
in position. Test drugs are injected through
this cannula.
Now carefully expose the
left carotid artery which lies deep in the muscle
tissue and runs parallel to the trachea using, of
course, blunt dissection. Note the white
vagus nerve running in the same sheath as the carotid.
Separate the artery from the nerve with the glass
probe. Now elevate the freed section of artery
by placing forceps under it. Place one 6 inch
section of surgical thread under the artery cephalic
to the elevated portion and three sections of thread
below the elevated portion.
Now you are ready to insert
the arterial cannula. Tie off the cephalic ligature,
occluding the artery. Temporarily occlude
blood flow from the heart by pulling up on the caudal
most section of thread. With the blood flow
occluded in this way, use a sharp needle to make a
small nick in the artery and introduce the tip of
the cannula into the incision running towards the
heart. Secure the cannula in place with
the remaining two ligatures already in position.
The caudal most ligature should now be released, allowing
blood to flow into the cannula.
It is crucial, of
course, that you are certain that the carotid cannula
and the blood pressure transducer are fluid filled
before you insert the cannula.
D. General Procedures
Once the carotid cannula
is securely in place, inject 0.3 ml. of heparinized
saline (100 units/ml) through the cannula and into
the artery. Simply place a syringe containing
the heparinized saline on the free outlet (or port)
of the 3-way stopcock. Open the valve so that
the cannula and syringe are in communication and slowly
inject the saline. Change the valve lever so
that the cannula and transducer are in communication.
This procedure should be repeated if blood begins
to come up the cannula. (Never allow blood to
enter the transducer. Thoroughly flush the transducer
at the end of the experiment if you do.)
To record respiration, use
thread to suspend a bent pin or alligator clip from
the transducer. Hook or clip the thread onto
the rat's chest (subcutaneously) at the point of maximal
expansion with each inhalation. Obtain enough
tension on the transducer lever and adjust the transbridge
sensitivity until a respiration recording is visible
on screen.
Test drugs are injected
through the jugular vein cannula. Simply fill
a 1 ml syringe with the correct volume of drug solution
(0.2 ml works well), remove the trapped air bubbles,
and administer through the cannula. The volume
of the drug should be < 0.5 ml and should be followed
by just enough saline (0.2 ml works well here too)
to flush the drug through the cannula. Warm
all injection solutions to room temperature.
At the end of the experiment,
inject 1.0 ml of saturated KCl solution through the
cannula to euthenize the rat.
A word about your recordings:
Remember that you are not only looking for the effect
of the drug or treatment on BP and respiration, but
you are also looking for homeostatic mechanisms of
recovery. It is wise, therefore, to have a pre-treatment
recording, a treatment recording (including the time
course of the treatment), and a post-treatment of
recovery recording. All your data will be quantitative
(i.e., in mm Hg)! Be certain to note the time
of injection or treatment, the drug or treatment,
and the dose on your WINDAQ record.
V. EXPERIMENTS
Before you begin the experiments,
you should predict the results of each experiment
by recording increase, decrease or No  on your BP data sheets (located at the end of this
chapter). Consult references when necessary,
but these predictions are to be completed independently,
i.e., without the aid of your colleagues. The
ECVREX, Cardiolab, and MacMan simulations may be used.
After completing the exercises, record your quantitative
data (e.g., HR in beats/min., respiration in breaths/min,
and BP as systolic/diastolic in mm Hg). You
will be asked to explain in detail the results of
selected experiments.
on your BP data sheets (located at the end of this
chapter). Consult references when necessary,
but these predictions are to be completed independently,
i.e., without the aid of your colleagues. The
ECVREX, Cardiolab, and MacMan simulations may be used.
After completing the exercises, record your quantitative
data (e.g., HR in beats/min., respiration in breaths/min,
and BP as systolic/diastolic in mm Hg). You
will be asked to explain in detail the results of
selected experiments.
This exercise will require
direct stimulation of the intact and severed vagus
nerves. You have already located them in the
connective tissue sheath containing the carotid arteries.
They can be separated from the carotids by careful
teasing with bunt probes. A ligature loosely
placed around them will make them easier to find during
the experiment.
Remember that the vagi contain
efferent, parasympathetic fibers releasing ACh onto
the SA and AV nodes of the heart and afferent, sensory
fibers from the aortic arch baroreceptors and from
the stretch receptors in the lung (see Figure 4).
These stretch receptors signal inflation of the lungs
and inhibit the Dorsal Respiratory Group neurons in
the medulla. Thus stimulation of an intact vagus
will activate both afferent and efferent fibers.
**We recommend the following order of treatments
and drug doses. Remember that these doses
are per kg of rat body weight. You may assume
that the rats weigh about 0.5 kg.**
***At this point, you should have a some idea as to
the animals general response to each treatment. If
not, STOP and try to determine what you should
expect to observe. If you witness no response to
a treatment, STOP !!! Is this what you expect,
why or why not ? (When in doubt, ASK FOR HELP !!!)
The stock concentrations of each drug will be provided
to you,by your TA. Remember, use a volume of 0.2 ml
and the rat weighs 0.5 kg. Determine how you should
proceed from here in making your drug dilutions.
1. Right Vagal Stimulation:
10 pulses/sec; 25 msec duration; ~ 3 to 10 volts
2. Cut Right Vagus and observe
3. Stimulate cephalic (proximal)
end of right vagus
4. Stimulate caudal (distal)
end of right vagus
5. Ach: 0.1 - 0.5ug/kg
6. Eserine: 0.05-0.2 mg/kg
7. Ach: (same dose as in
#5 above)
8. Stimulate cephalic end
of right vagus; stimulate caudal end of right vagus.
9. Atropine: 1 mg/kg
10. ACh: (same dose as in #5 above)
11. Stimulate cephalic end of right vagus;
stimulate caudal end of right vagus
12. Epi: 0.5 ug/kg
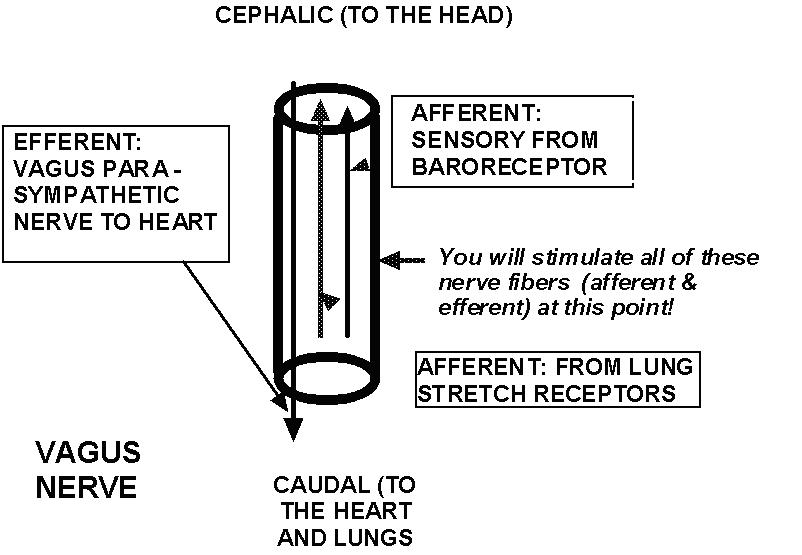
Figure 4: The Vagus nerve
_______________________________________________________________
13. NE: 0.5 ug/kg
20. Ephedrine: (same as in #14 above)
14. Ephedrine: 0.5-2.5 mg/kg
15. Phentolamine: 100 ug/kg
16. Epi: 0.5 ug/kg
17. NE: 0.5 ug/kg
18. Ephedrine: (same as in #14 above)
19. Propranolol: 100 ug/kg
20. Epi: 0.5 ug/kg
Download BP Lab Data Page 1 here.
Download BP Lab Data Page 2 here.
Back to the top
