Patent Tong Survey
The final step in our monitoring of restored oyster populations in Maryland is our annual patent tong survey. Patent tongs are hydraulic claws that sample a finite area of the bottom and bring it to the surface, where the contents of the tongs can be quantified. Each year, restored bars that are three and six years old are candidates for patent tong surveys. Not every bar is surveyed each year; bars with more existing historical data are targeted over bars that have not been surveyed in the past in order to build a complete restoration picture of as many bars as possible.
The patent tong survey is conducted with the help of Maryland’s watermen in order to foster a productive relationship between our lab and the Bay community. The watermen that participate in our survey are interested in Bay restoration and understand the importance of collecting good data in the management of species in the Bay. We are fortunate to have the opportunity to work with many watermen during our patent tong survey each year. Below are some pictures of us out on the patent tong survey.
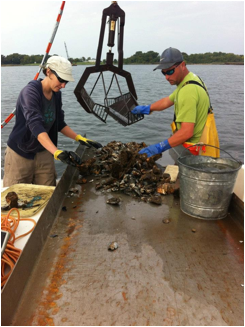
Figure 1. Paynter Lab staff work with local watermen to conduct patent tongs surveys of oyster bars throughout the northern portion of the Chesapeake Bay. Here, a tong grab was just emptied on the table and is being inspected for live and box oysters
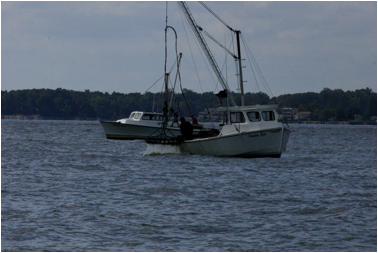
Figure 2. An example of a boat equipped with hydraulic patent tongs, used to collect oysters from the bottom.
Once sites have been selected for patent tonging, a 25 m by 25 m grid is overlaid on the target area using spatial mapping software. Each grid cell will be sampled by the patent tongs during the survey. Below is an example of a patent tong survey grid with sampling points from the 2011 survey at Blunt oyster bar in the Chester River.
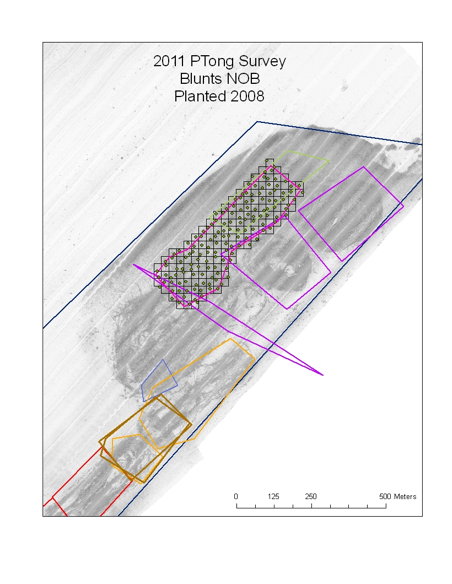
Figure 3. An example of a survey plot generated using spatial mapping software. Colored polygons represent previous plantings of spat-on-shell. The largest dark blue polygon represents a historical oyster bar (yates bar). The black grid with green circles shows the survey grid with points marked to identify exactly where tongs were dropped.
Data on oyster size, density and disease as well as bottom conditions are collected at each point in the survey. Below is a table outlining the data collected at each point in the patent tong survey.
Table 1. Summary of data collected at each point during patent tong surveys.
Data Type |
Description |
Substrate |
Primary, secondary, and tertiary substrate present in each grab.
(Oyster, loose shell, shell hash, sand, mud, rock, or hard bottom) |
Shell Score |
Amount of shell in the patent tong on a scale from 0-5.
(0 = no shell in tongs, 5 = tongs full of shell) |
Percent Black/Buried Shell |
The relative percentage of black shell that was buried in anoxic mud prior to tong collection.
(Only applies to grabs with shell.) |
Oyster Number |
Each live and dead oyster was counted in each grab.
If tongs contained an amount of oysters rendering it impractical to count/measure all animals, a subsample (50%) was counted and used to estimate the full amount. |
Oyster Size |
Each live and dead oyster (box or gaper) was measured to the nearest mm.
If more than 50 oysters were found, the first 50 were measured and remaining animals were counted. |
Since the survey is conducted over a grid, data from each point are extrapolated over the area of each grid cell (625 m2) to obtain oyster population estimates as well as create a picture of the bottom at each survey. Data are interpolated using ArcGIS spatial software. Below are oyster density and shell score plots from the 2011 patent tong survey of Bolingbroke Sands oyster bar in the Choptank River.
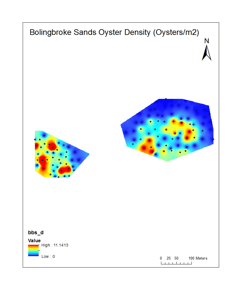
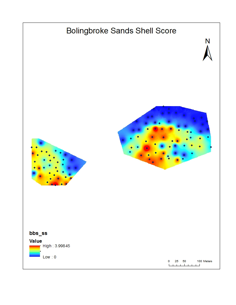
Figure 4. Examples of oyster density and shell score plots generated from patent tong survey data. Red and warmer colors represents areas of high oyster density or high shell score, while blue (cooler) colors suggest lower oyster densities and lower shell scores.
The patent tong survey also provides data on the disease level of adult oysters found on the bar. Oysters are sampled for disease according to standard practices (Ray 1952) and disease data are added to a growing database of oyster disease levels in Maryland. For more information on the disease monitoring done in our lab please visit the Disease Monitoring section of our page.
The data from the patent tong survey provide critical information on the long term growth, survival, health and distribution of restored oyster populations in Maryland. The fine scale of our survey assures that the data collected provide an accurate picture of each bar that is surveyed. The value of our surveys has been recognized and in 2011 two complete tributaries (Harris Creek and the Little Choptank River) were added to the survey with small modifications in order to understand adult oyster distribution and bottom conditions on a larger scale. We continued tributary-wide surveys in 2012 (Nanticoke River) and 2013 (Broad Creek), and information regarding these data is available upon request.
For more specific patent tong data inquiries please email us at: paynteroysterlab@gmail.com